 ~
~e-Receipt graphs
In the e-Receipt app you can use graphs to view information about revenues and transaction revenues information.
1. Introduction
In e-Receipt app you can use graphs to view information about revenues and transaction revenues information. The application allows you to pre-set the date range and currency for data filtering. The application is divided into five parts. These are:
- General
- By payment card
- By transaction type
- By transaction status
- By sales range
 ~
~2. General
When you click on the General tab, it will dispaly filters, that can be used to display revenues on a specific date and for a specified group. From the group point of view it is possible to display values at the merchant, point of sales and POS terminal. A selection field for group specification is displayed at the Point of sales and POS terminal. An example would be a Point of sale where it is possible to specify merchant store.
After selecting the group and period, you can filter the values using the filter button. The Clear Filter button allows you to return the filter to its original values.
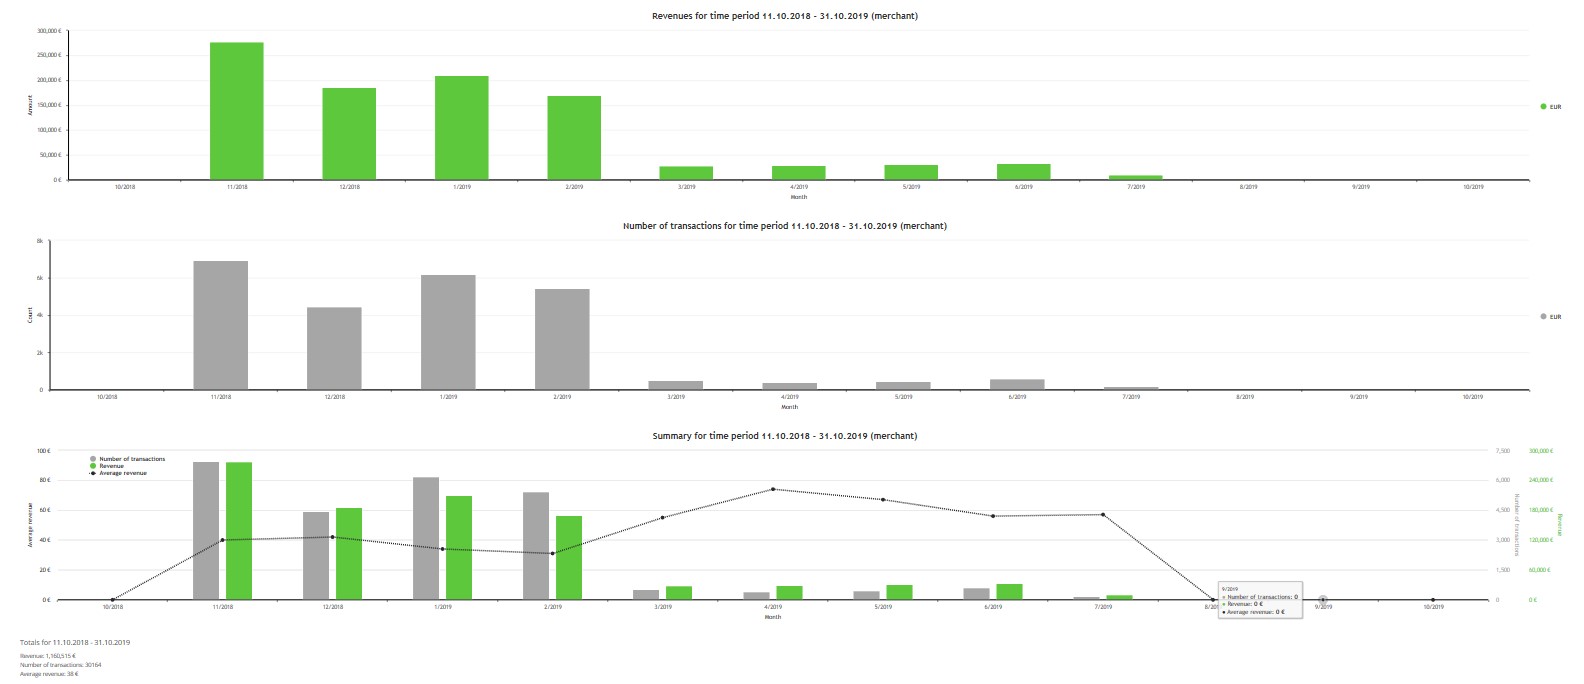
The filtered values are reflected in the graphs as shown in the picture. The graphs show revenues, the number of transactions and the overall view of the period. There is a small summary at the bottom of the page in the selected period.
3. Specific view
3.1 By payment card
The tab displays an overview of the selected payment card. The principle of filtering is the same as the general tab. The only difference is the addition of a new filter field "Credit card". The filtered values are displayed in graphs. The share of revenue for the period will be reflected in the pie chart at the bottom of the page.
3.2 By transaction type
The tab displays an overview by selected transaction type. Using the "Transaction type" selection field, it is possible to filter the value according to the selected transaction type (sale, refund, etc.), which is reflected in the graphs.
3.3 By transaction status
The added "Transaction Status" selection field allows you to view a summary of transactions that are either online, offline, or differently processed.
3.4 By sales range
This tab displays transactions in the selected amount range using the "Sales range" selection field.


